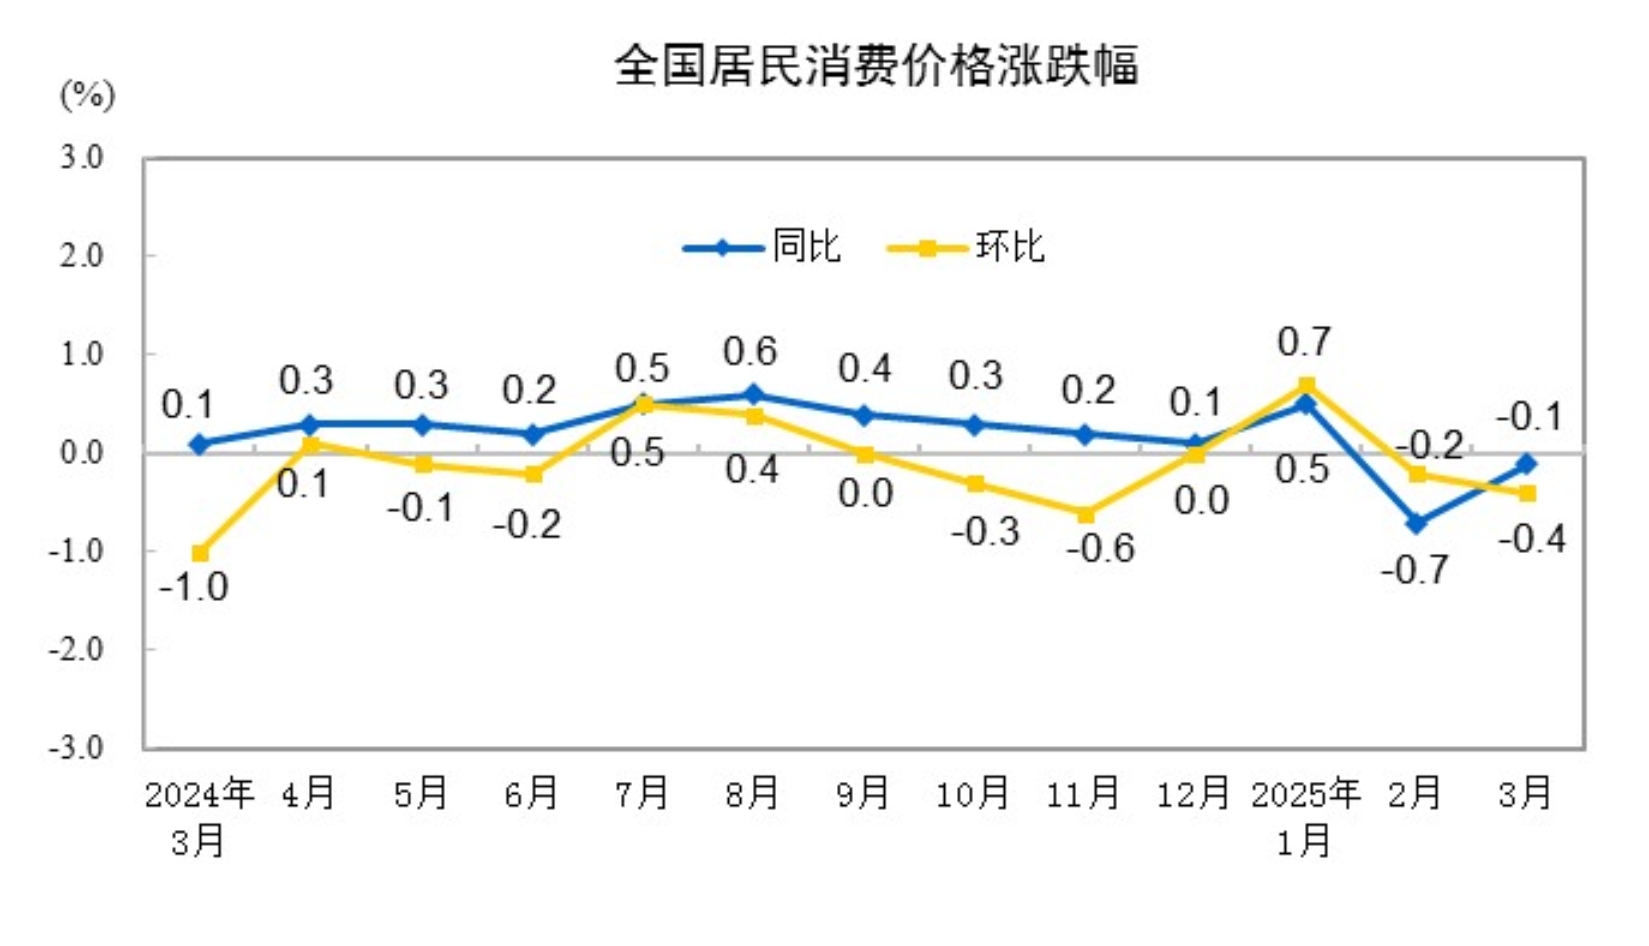
CCTV News: According to the National Bureau of Statistics, in March 2025, the national consumer price fell by 0.1% year-on-year. Among them, cities fell by 0.1%, rural areas fell by 0.3%, food prices fell by 1.4%, non-food prices rose by 0.2%, consumer goods prices fell by 0.4%, and service prices rose by 0.3%. On average from January to March, the national consumer price fell by 0.1% compared with the same period last year.
In March, the national consumer price fell by 0.4% month-on-month. Among them, cities fell by 0.4%, rural areas fell by 0.3%, food prices fell by 1.4%, non-food prices fell by 0.2%, consumer goods prices fell by 0.4%, and service prices fell by 0.4%.
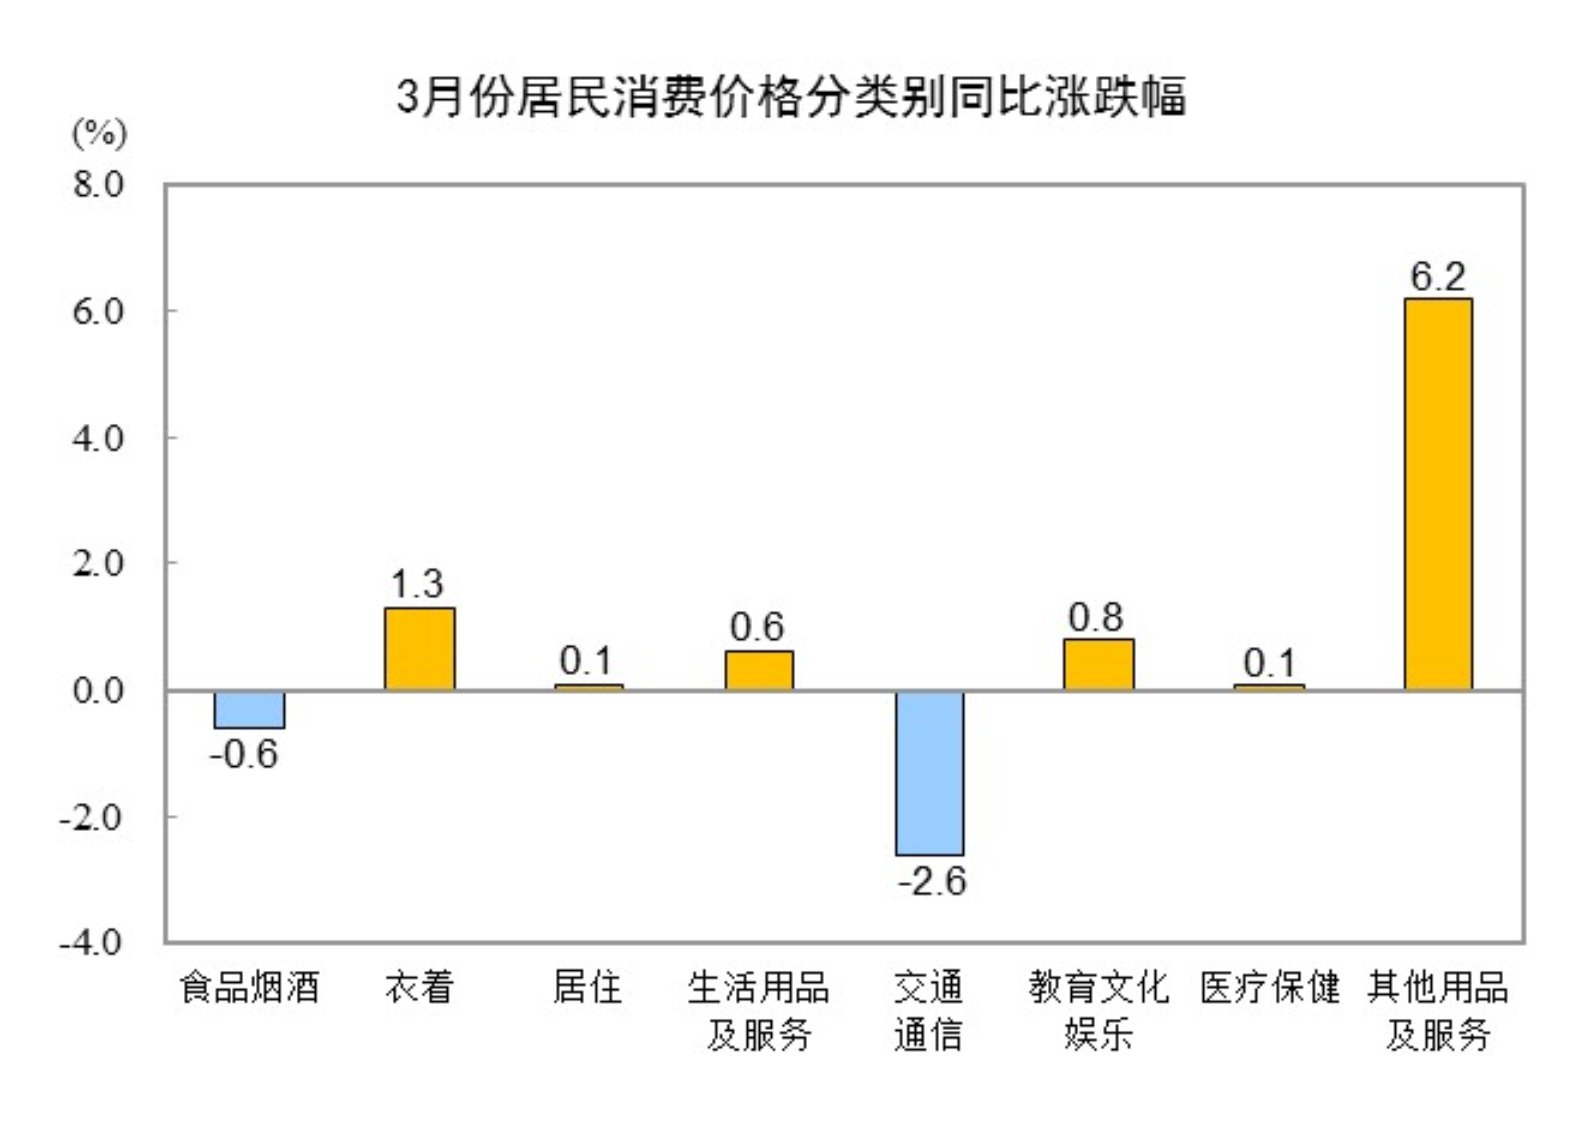
1. Year-on-year changes in the prices of various goods and services
In March, the prices of food, tobacco and alcohol fell by 0.6% year-on-year, affecting the CPI (consumer price index) by about 0.17 percentage points. Among foods, the price of fresh vegetables fell by 6.8%, affecting the CPI by about 0.15 percentage points; the price of eggs fell by 1.6%, affecting the CPI by about 0.01 percentage points; the price of grain fell by 1.5%, affecting the CPI by about 0.03 percentage points; the price of pork rose by 6.7%, affecting the CPI by about 0.08 percentage points; the price of fresh fruit rose by 0.9%, affecting the CPI by about 0.02 percentage points.
The prices in the other seven categories rose and fell year-on-year. Among them, the prices of other supplies, services and clothing rose by 6.2% and 1.3% respectively, the prices of education, culture, entertainment, daily necessities and services rose by 0.8% and 0.6% respectively, and the prices of residence and health care rose by 0.1% respectively; the prices of transportation and communications fell by 2.6%.
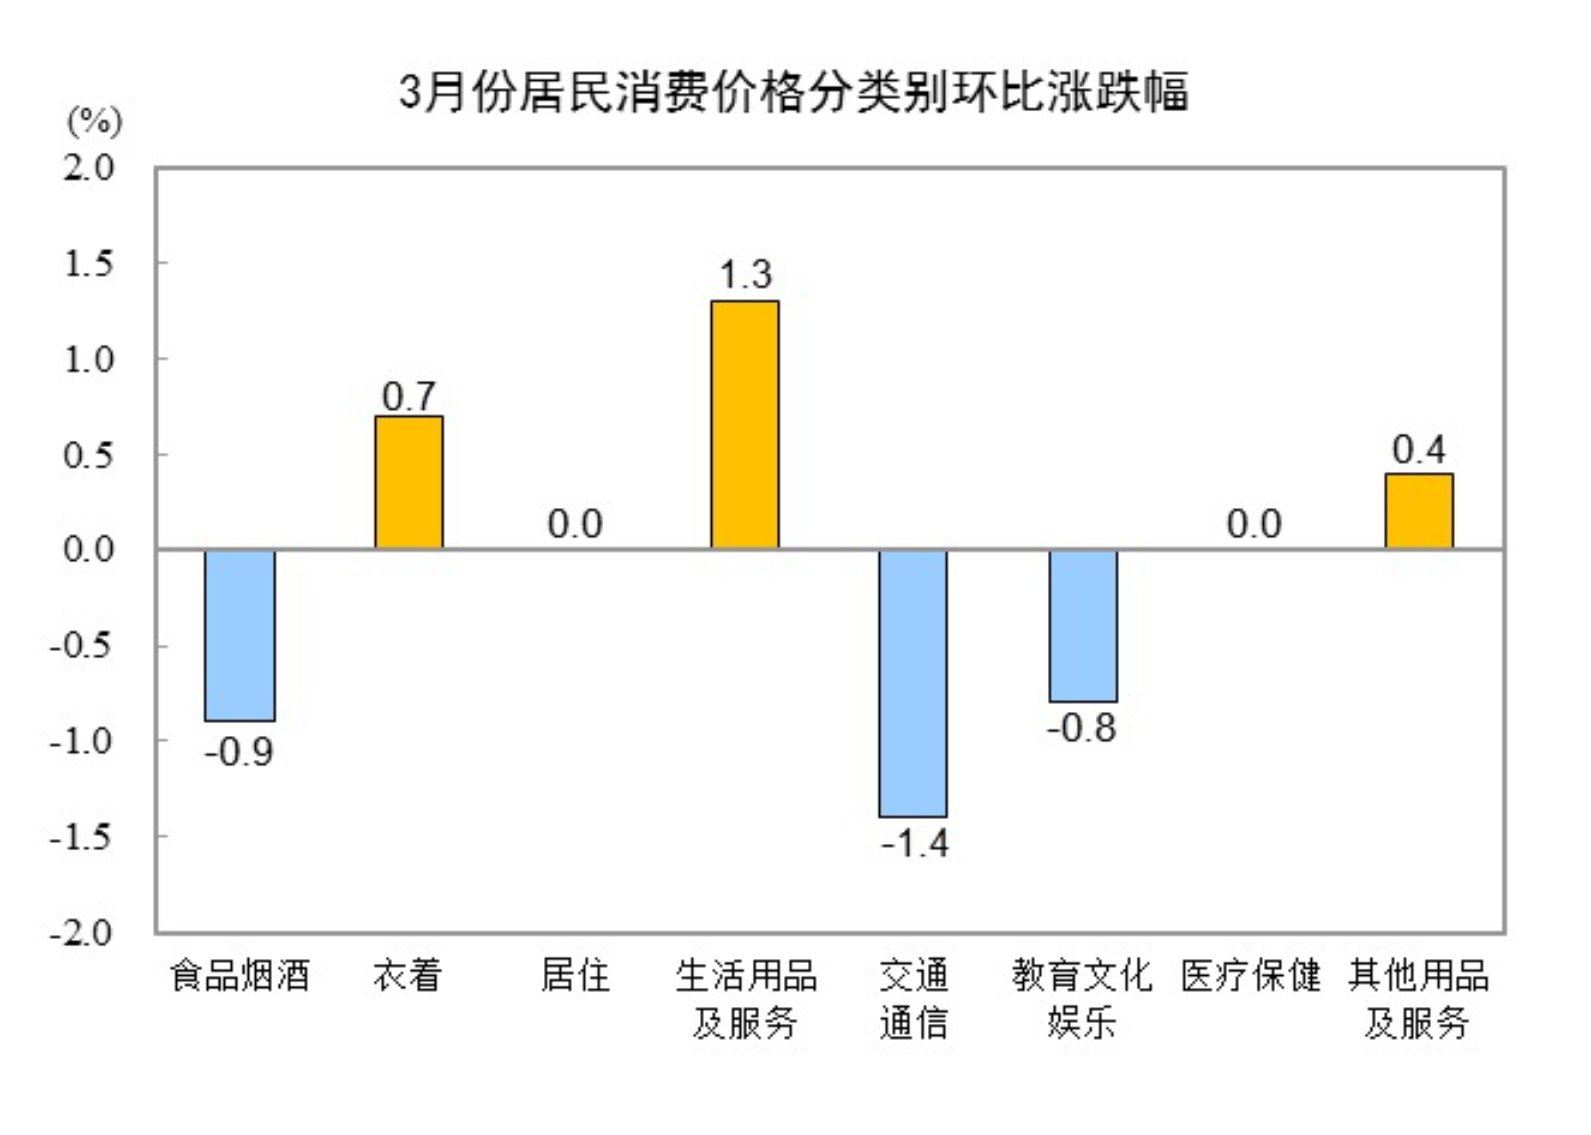
2. Changes in the price of various goods and services on a month-on-month basis
In March, the prices of food, tobacco and alcohol fell by 0.9% month-on-month, affecting the CPI decline by about 0.24 percentage points. Among foods, the price of fresh vegetables fell by 5.1%, affecting the CPI by about 0.11 percentage points; the price of eggs fell by 2.7%, affecting the CPI by about 0.02 percentage points; the price of livestock and meat fell by 2.2%, affecting the CPI by about 0.07 percentage points, of which pork prices fell by 4.4%, affecting the CPI by about 0.06 percentage points; the price of fresh fruits fell by 1.6%, affecting the CPI by about 0.03 percentage points.
The other seven categories of prices rose three times, two slumped and two fell. Among them, the prices of daily necessities and services, clothing, other necessities and services rose by 1.3%, 0.7% and 0.4% respectively; the prices of residence and health care remained the same; the prices of transportation, communications, education, culture and entertainment fell by 1.4% and 0.8% respectively.
Main data on consumer prices in March 2025
Monopoly on month-online
(%)
Year-on-year increase and decrease
(%)
January-March
Year-year increase and decrease (%)
Consumption prices
-0.4
-0.1
-0.1
Inside: City
-0.4
-0.1
-0.1
-0.1
Rural
-0.3
-0.3
-0.3
-0.2
-0.2
Inside: Food
-1.4
-1.4
-1.5
Non-food
-0.2
0.2
0.2
Inside: Consumer Goods
-0.4
-0.4
-0.4
Service
-0.4
>0.3
0.3
Including: Excluding food and energy
0.0
0.5
0.3
0.3
1.1. Food, tobacco and alcohol
-0.9
-0.6
-0.7
Grain
0.0
-1.5
-1.4
Food oil
-0.1
-2.1
-2.2
Fresh vegetables
-5.1
-6.8
-5.9
Animal meat
-2.2
-0.1
0.2
Including: Pork
-4.4
6.7
8.1
Beef
0.5
-10.8
-12.4
mutton
-0.4
-5.4
-5.9
Aquatic products
-0.2
-0.2
-0.2
>-0.9
egg
-2.7
-1.6
-1.1
milk
0.0
-1.7
-1.6
-1.6
fresh fruit
-1.6
0.9
-0.1
cine
0.0
0.3
0.4
wine
0.6
-1.8
-2.1
2. Clothing
0.7
1.3
1.2
Clothing
0.7
1.5
1.4
Seals
0.7
0.5
0.3
III. Living
0.0
0.1
0.1
0.1
Lease rental
0.1
-0.1
-0.2
hydropower
0.0
0.3
0.3
IV. Daily necessities and services
1.3
0.6
-0.4
Home Appliances
2.8
-0.3
-2.4
Home Services
-0.3
1.7
2.7
V. Transportation Communications
-1.4
-2.6
-1.9
Transportation
-0.4
-4.0
-4.2
Fuel for Transportation
-3.5
-5.7
-2.5
>Use and Maintenance of Transportation
-0.1
0.3
-0.2
Communication Tools
-0.2
1.4
1.1
Communication Services
0.0
0.0
0.0
0.0
0.0
Position Services
0.0
-0.3
0.1
6. Education, Culture and Entertainment
-0.8
0.8
0.7
Education Services
0.1
1.2
1.2
Travel
-5.9
-0.9
-1.6
7. Healthcare
0.0
0.1
0.3
Traditional Medicine
0.1
0.5
0.6
Western Medicine
-0.2
-1.2
-1.1
Medical Services
0.0
0.4
0.7
8. Other Supplies and Services
0.4
8. >6.2
6.0
Notes
1. Indicator Explanation
Consumer Price Index (CPI) is a relative number that measures the price level of residents' consumer goods and services over time, and comprehensively reflects the changes in the price level of residents' consumer goods and services purchased.
2. Statistical scope
Statistical survey of residents' consumer prices covers 8 categories, 268 basic categories of goods and services, including food, tobacco, alcohol, clothing, residence, daily necessities and services, transportation and communications, education, culture and entertainment, medical care, other supplies and services, and the daily necessities and services for urban and rural residents' daily consumption.
3. Investigation method
Sample survey method is used to select and determine the survey outlets. According to the principle of "determined person, fixed point, and time", people are directly sent to the survey outlets or collect the original price from the Internet. The data comes from about 500 cities and counties in 31 provinces (autonomous regions and municipalities) across the country, and nearly 100,000 price survey points, including shopping malls (stores), supermarkets, farmers' markets, service outlets and Internet e-commerce.
4. Data Description
Due to "rounding", sometimes the total data is the same as the high or low value of the classified data.