CCTV News: According to the WeChat official account of the Ministry of Ecology and Environment, the Ministry of Ecology and Environment announced the national environmental air quality status in January 2025 to the media today.
Air Quality
1. Overall situation
In January, the average concentration of PM2.5 in 339 prefecture-level and above cities across the country was 53.1 micrograms/cubic meter, an increase of 4.7% year-on-year; the average concentration of PM10 was 80 micrograms/cubic meter, an increase of 8.1% year-on-year; the average concentration of O3 was 98 micrograms/cubic meter, an increase of 15.3% year-on-year; the average concentration of SO2 was 10 micrograms/cubic meter, an increase of 2.7% year-on-year; the average concentration of NO2 was 30 micrograms/cubic meter, a decrease of 6.2% year-on-year; the average concentration of CO was 1.2 mg/cubic meter, an increase of 2.2% year-on-year.
In January, the proportion of days with good air quality in 339 prefecture-level and above cities across the country was 78.0%, a year-on-year decrease of 0.5 percentage points; the proportion of days with severe and above pollution was 2.6%, a year-on-year increase of 0.4 percentage points. The average number of days exceeding the standard caused by sandstorms is 1.1%, of which the proportion of days with severe and above pollution is 0.2%.
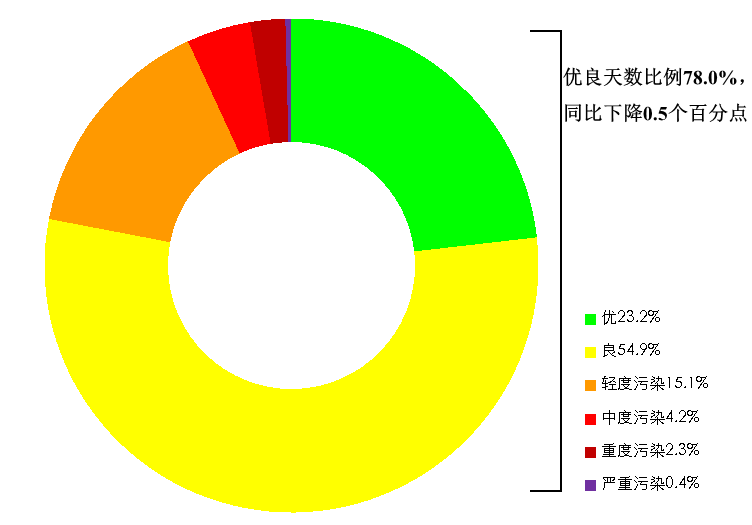
Figure 1 The proportion of days at all levels in 339 prefecture-level and above cities across the country in January 2025
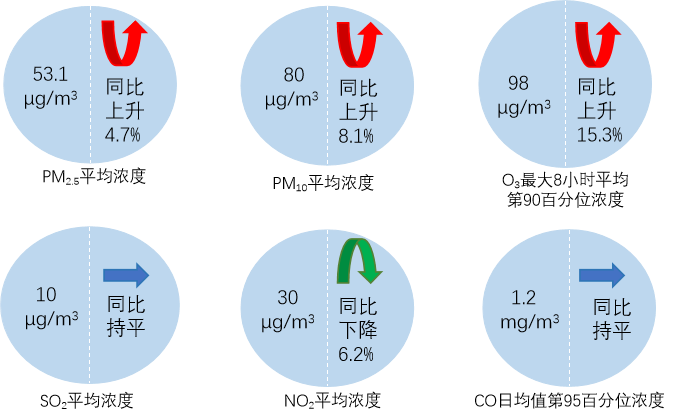
Figure 2 In January 2025, the concentration and year-on-year changes of six indicators in 339 prefecture-level and above cities across the country
2. Key areas
(I) Beijing-Tianjin-Hebei and surrounding areas
In January, the average PM2.5 concentration in "2+36" cities in Beijing-Tianjin-Hebei and surrounding areas was 61.0 micrograms/cubic meter, a year-on-year decrease of 18.3%; the average O3 concentration was 83 micrograms/cubic meter, a year-on-year increase of 13.7%; the average proportion of excellent days was 68.5%, a year-on-year increase of 7.4 percentage points; the average proportion of severe and above pollution days was 2.9%, a year-on-year decrease of 6.8 percentage points. The average number of days exceeding the standard caused by sandstorms is 0.5%, and no severe or above pollution occurs.
In January, the PM2.5 concentration in Beijing was 28.3 micrograms/cubic meter, a year-on-year decrease of 23.5%; the O3 concentration was 69 micrograms/cubic meter, a year-on-year increase of 1.5%; the proportion of excellent days was 93.5%, a year-on-year increase of 3.2 percentage points; there were no severe or above days of pollution, and the same year-on-year remained the same. No exceeding the standard due to sandstorms appeared.
(II) Yangtze River Delta Region
In January, the average PM2.5 concentration in 31 cities in the Yangtze River Delta region was 58.0 micrograms/cubic meter, a year-on-year decrease of 12.3%; the average O3 concentration was 103 micrograms/cubic meter, a year-on-year increase of 21.2%; the average proportion of excellent days was 73.8%, a year-on-year increase of 13.6 percentage points; the average proportion of severe and above pollution days was 0.9%, a year-on-year decrease of 1.1 percentage points. No exceeding the standard due to sandstorms appeared.
(III) Fenwei Plain
In January, the average PM2.5 concentration in 13 cities in the Fenwei Plain was 61.8 micrograms/cubic meter, a year-on-year decrease of 5.5%; the average O3 concentration was 89 micrograms/cubic meter, a year-on-year increase of 18.7%; the average ratio of good days was 72.0%, a year-on-year increase of 6.3 percentage points; the average ratio of severe and above days was 5.2%, a year-on-year increase of 2.5 percentage points; the average ratio of days exceeding the standard caused by sandstorms was 0.2%, and no severe or above days were polluted.
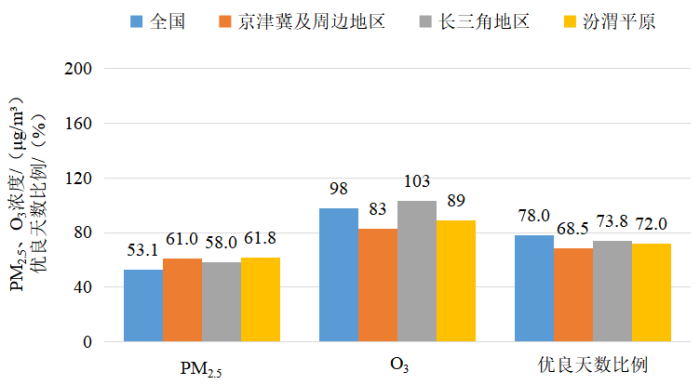
Figure 3 Comparison of air quality in the country and key areas in January 2025
3. Key cities
In January, among the 168 key cities: the top 20 cities with better air quality are Zhangjiakou, Lhasa, Kunming, Beijing, Fuzhou, Xiamen, Zhoushan, Dalian, Chengde, Haikou, Huizhou, Lishui, Huangshan, Shenzhen, Taizhou, Guiyang, Qinhuangdao, Zhuhai, Wenzhou and Dongguan; the last 20 cities with poor air quality are Harbin, Urumqi, Xianyang, Xi'an, Jingzhou, Changde, Xiangyang, Xiaogan, Yuncheng, Nanyang, Zhuzhou, Yiyang, Changsha, Luohe, Yichang, Zhoukou, Lanzhou, Xiangtan, Yueyang and Weinan.
In January, among the 168 key cities: the top 20 cities with low PM2.5 concentrations are Lhasa, Zhangjiakou, Xiamen, Beijing, Haikou, Shenzhen, Fuzhou, Kunming, Zhoushan, Huizhou, Chengde, Zhuhai, Dongguan, Dalian, Qinhuangdao, Zhongshan, Lishui, Guangzhou, Luliang and Zhaoqing; the last 20 cities with high PM2.5 concentrations are Harbin, Changde, Jingzhou, Urumqi, Guang'an, Yiyang, Xi'an, Xianyang, Zhoukou, Luohe, Yichang, Shangqiu, Nanyang, Xiaogan, Luzhou, Xiangyang, Xuchang, Jingmen, Fuyang and Changsha.